What is Liquidity
Liquidity is the open interest of buyers and sellers in the market and can be further defined by those entities at or near specific price levels.
It can refer to the degree to which a market (asset or security) can be quickly bought or sold in the market without affecting the assets price.
We refer to Liquidity in two ways External Liquidity which can be identified by buy orders above market highs and sell orders below market lows and secondly Internal Liquidity as buy and sell orders within an Order Block.
Why is Liquidity Useful
The market seeks liquidity, and there are buy and sell orders above highs and lows. There are buy orders above highs due to buy stop orders being placed here for market participants who are short. There are also buy orders in this area from market participants who are playing the break out trade with buy stop orders.

The theory is that larger market players are waiting in these areas, called liquidity pools with their limit orders ready to snatch up the stop orders from the market. Once they have these orders price will move in the opposite direction.
The market is always going to move towards levels of liquidity, once that liquidity is taken the market will move to another liquidity pool.
Where is liquidity found
Buy side liquidity can be found anywhere above a short, intermediate or long time high. This can include single candles, or multiple candles creating these highs.
Sell side liquidity can be found anywhere below a short, intermediate or long term low. This can include single candles, or multiple candles creating these highs.
The best pools of liquidity can be found at key levels. To locate liquidity pools ask yourself:
- If I was short right now where could my buy stop be?
- If I were long right now where could my sell stop be?
Asking these questions on different time frames can give you an understanding of where the largest liquidity pools are.
There are different types of Liquidity.
- External Range Liquidity
- Internal Range Liquidity

External Range Liquidity
- Current Trading Range will have buy side liquidity above the range high
- Current Trading Range will have sell side liquiidty below the range low
- Runs on Liquidity seek to pair orders with the pending order liquidity – Liquidity Pools
- External Range Liquidity Runs can be Low resistance or high resistance in nature
Internal Range Liquidity
- When current trading range is likely to remain, liquidity voids and Fair Value Gaps will fill in – Gap Risk
- Order Blocks within a Trading Range will be populated with new buy and sell orders, this is our internal range liquidity
- Market Maker Buy and Sell Models will form inside trading ranges.
Depending on what you see best in the charts should determine how you tradel.
One model is to buy or sell in the Internal Range Liquidity (Order Blocks) with the target to take profit at external range liquidity (Range Highs or Lows). This should be executed while in sync with the Monthly Institutional Order Flow as this is the time frame the Institutions trade on.
Another option is to buy sell stops or sell buy stops.
Low and High Resistance Liqudiity
As a Trader you want to enter your trades in low resistance conditions. The less resistance in your path of profitability the higher the probability the trade will work out.
- A low resistance liquidity run is a trade that is in the direction of the weekly or monthly chart.
- A high resistance liquidity run is a trade that is in the opposite direction of the weekly or monthly chart
As a short example below, when we get a large displacement, or large move higher, where price quickly moved up. We expect price to return to fill this gap down to the next level of prior resistance and new support, likely an order block.
As price begins trade lower and breaks an old low, the market will trade easily down breaking low after low until it fills this point where the short term high was broken. You would be selling short into a low resistance liquidity run until you hit this resistance.

direction.
Each week the market will seek to trade from one PD array to another with the least resistance. This could be trading from a premium to discount (shorts) or from a discount to premium (long). Identifying these low resistance areas on the higher time frames can provide a bias that can be used on the lower time frames to enter low resistance trades.
What are Key Levels
- Internal Range Liquidity
- Weekly Highs and Lows
- Daily Highs and Lows
- Higher Time Frame (HTF) Double Tops/Bottoms
- Supply and Demand Zones
- Swing Highs
- Swing Lows
- External Range Liquidity
- Order Blocks
- Rejection Blocks
- Breaker Blocks
- Propulsion Blocks
- Vacuum Block
These can also be defined as Premium and Discount Arrays
Premium and Discount Arrays
Premium
Old High or Low
Rejection Block
Bearish Order Block
Fair Value Gap
Liquidity Void
Bearish Breaker
Bearish Mitigation Block
Discount
Bullish Mitigation Block
Bullish Breaker
Liquidity Void
Fair Value Gap
Bullish Order Block
Rejection Block
Old Low or High
How to use Liquidity
- You want to identify key levels where there are lots of orders resting, these can be stop orders where market participants have their stop loss orders, or areas where break out traders are looking to enter the market with their stop orders.
- You want to see the market take out Sell Side Liquidity and then come back and close above this level.
- You want to see the market take out Buy Side Liquidity and then close lower than this level.
When the market does this, this can be a strong indication that the market is going to reverse in the opposite direction. The larger players have the liquidity they need now to push the market in the opposite
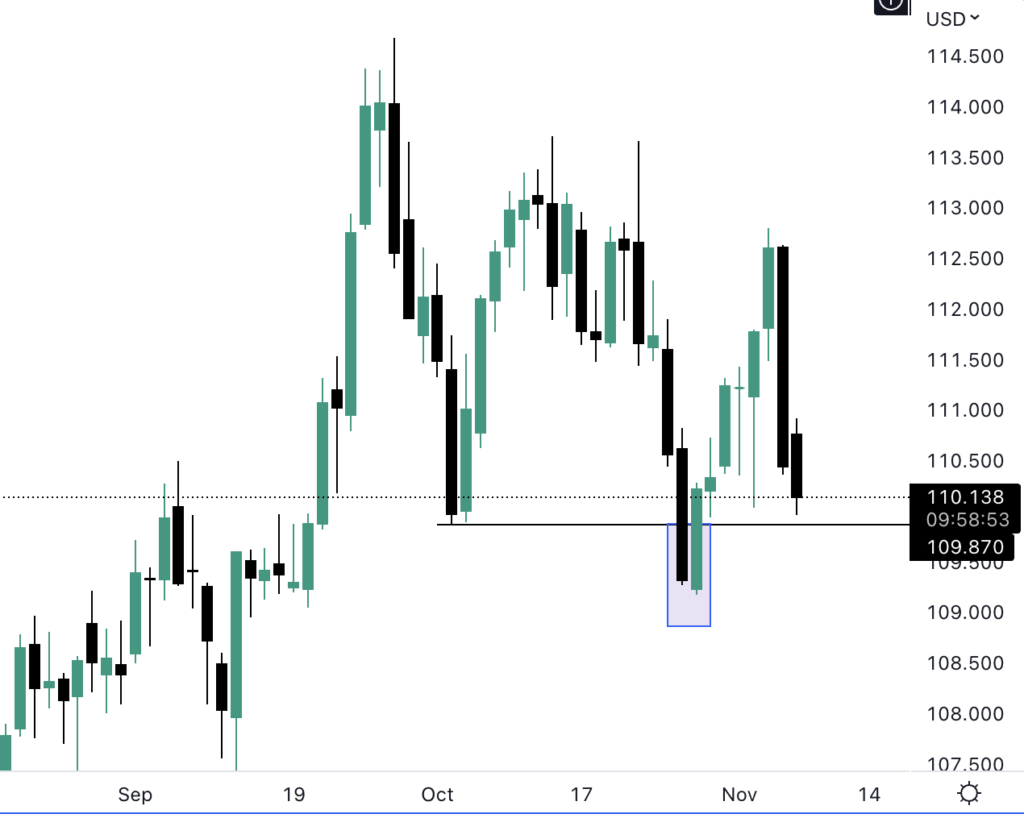
In the below image we can see that on the daily time frame that the previous support level or sell side liquidity level was broken. The next day it was immediately bough up again. Once we get a close back above this level we can see that the market rallies higher.

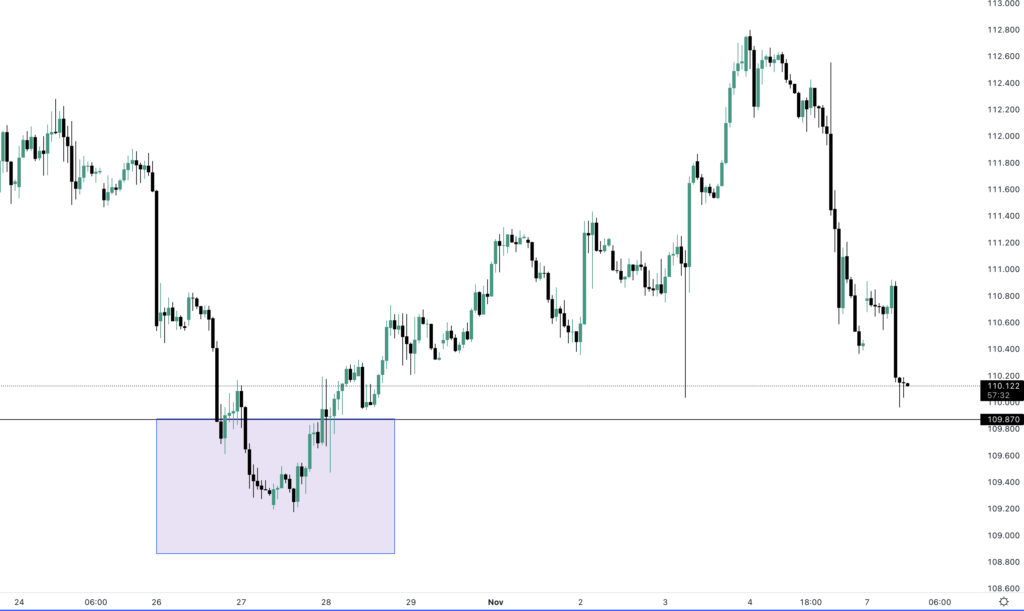
Now when we drop down to a lower time frame (H1) we can see that the market has some indecision at this area before heading higher, offering a good opportunity to get long.

There are many ways to use this information to enter the market
Examples:
- SFP – Swing Failure Pattern
- ICT 2022 Mentorship Model. (Liquidity + Displacement + MSS + FVG/OB)
- Retest of Support.
Run on Bullish Liquidity
- If we believe the market is pre disposed to go higher, then we would wait until the market goes down below an old low to knock out the bullish weak hands.
- The low that is under the current market price action will typically have trailed sell stops under it by long traders. Or sell stops for traders who wish to trade a breakout lower in price for a short position
- When the low is violated or price moves below the recent low, the sell stops become market orders to sell at market, this injects Sell Side Liquidity into the market, typically paired with smart money buyers.
- If you can purchase in this level, you are buying with the smart money
- You should always place a stop loss based on liquidity of your market.
Targets
If a liquidity pool can be used to enter a market it can also be used to exit a position. Identifying key levels to find existing liquidity pools can help you define where your targets should be once you have entered a position.
- How to identify which side of liquidity price will be delivered next? Is the range going to expand higher or lower?
- Trade Above an old high
- Trade into a bearish/bullish order block
- Trade into a Fair Value Gap
- Trade into a liquidity void
- What is expected at these times of day?
- Is the market pre disposed to go higher or predisposed to go lower
- What range is expected at these times of day?
- How does the market usually draw on buy side or sell side liquidity during the time you trade?
References:
- Liquidity Purge & Revert https://youtu.be/aWFSvqxEfg8
- Liquidity Pools https://youtu.be/Gnw54f9v6SA
- WATCH AGAIN Reinforcing Liquidity Concepts https://youtu.be/npL3ZXJ5zOU
- WATCH AGAIN Liquidity Runs https://youtu.be/22XkhpJR5eA
- Low Resistance Liquidity Run 1 https://youtu.be/y0lVKWLsZeM
- Low Resistance Liquidity Run 2 https://youtu.be/O69iFqP1j7o
